How to Know Which Restaurant Outlet Is Actually Making Money
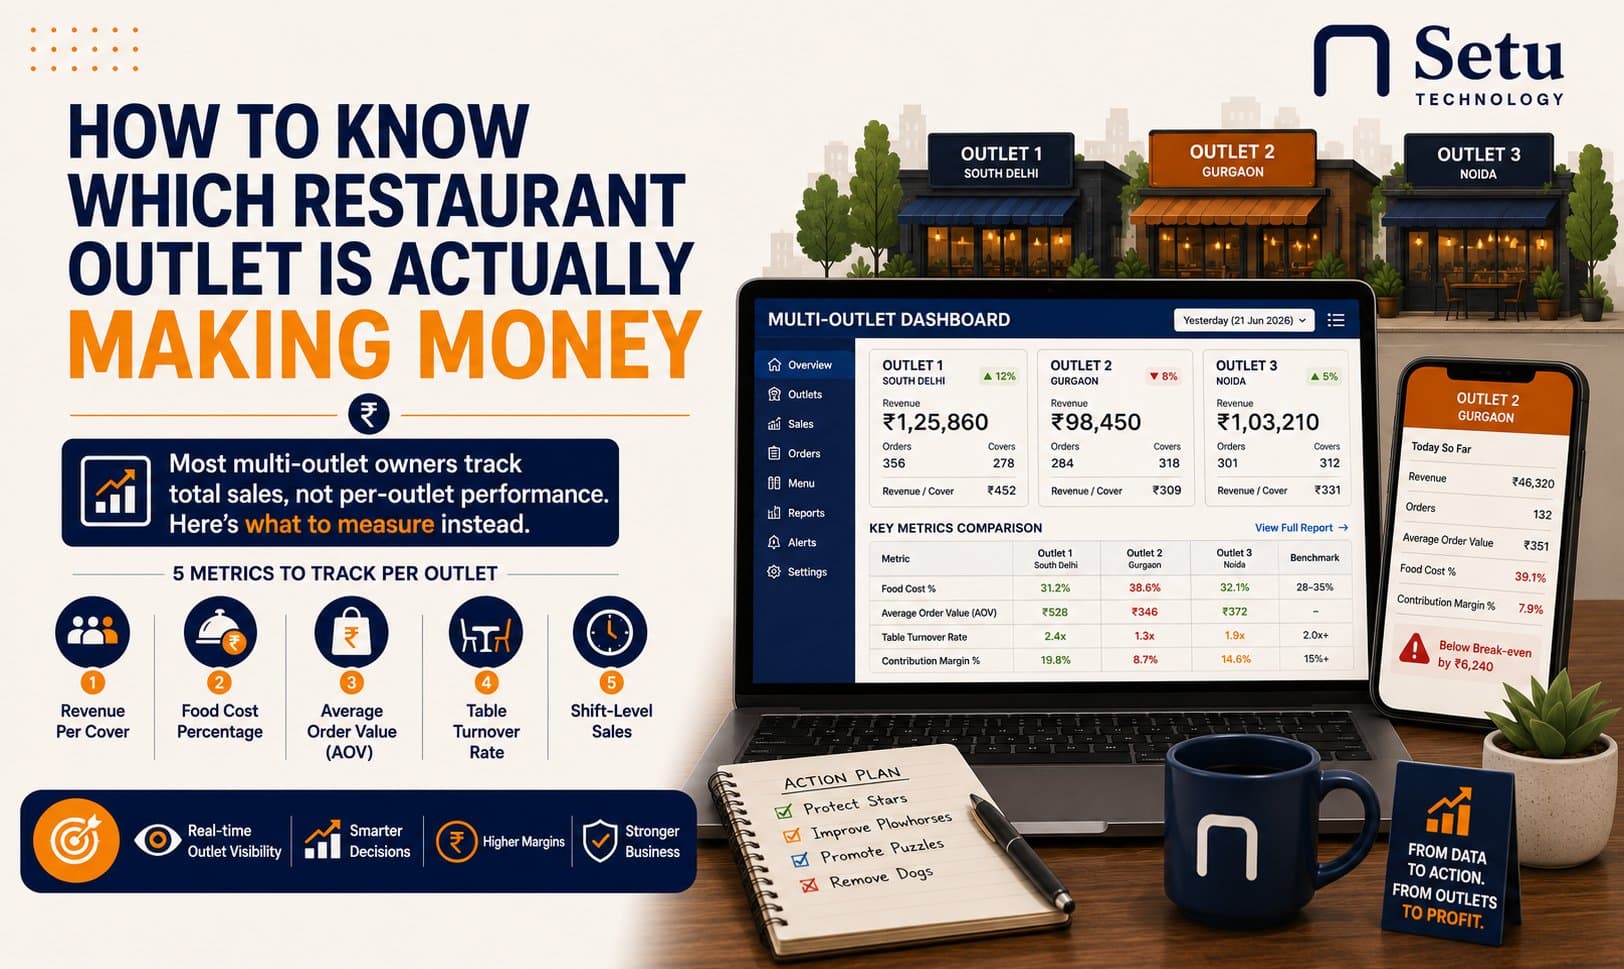
Running more than one restaurant outlet is a different game from running one. The complexity doesn't just double — it multiplies. And the most dangerous part isn't managing the chaos. It's thinking you have visibility when you don't.
Most multi-outlet owners we talk to are managing performance through end-of-day phone calls with managers, WhatsApp messages, and a rough mental map of which location "feels" busier. The problem isn't effort — they're working hard. The problem is that none of this tells you what's actually happening with money.
This article walks through what to measure, what to ignore, and how to spot a quietly underperforming outlet before it becomes a serious problem.
Why Most Multi-Outlet Owners Are Flying Blind
The default state for most multi-outlet restaurant businesses in India is fragmented data. Each outlet has its own billing register, or its own POS terminal that doesn't talk to the others. End-of-day reports are printed locally, handed to a manager, and consolidated — manually — into a spreadsheet by someone in accounts.
By the time that data reaches the owner, it's a day old, it's been aggregated into totals, and the nuance is gone. You see ₹85,000 in sales from Outlet 2 yesterday. But was that good or bad? Compared to what? Against what food cost? With how many staff on shift?
Total sales tells you almost nothing useful on its own.
What You're Missing When You Rely on Phone Calls
A manager reporting to you has a natural incentive to present their outlet in the best light. This isn't dishonesty — it's human. What you hear is total sales, busy periods and "it was a good day." What you don't hear:
- The two tables that walked out because service was slow
- The dish that's been returned twice this week
- The staff member who's consistently leaving 30 minutes early and skewing the labour cost
- The outlet that's doing high sales but has food costs quietly creeping above 35%
Phone calls give you narrative. You need data.
The 5 Metrics to Track Per Outlet — Not Just Total Sales
Once you move to per-outlet visibility, these are the numbers that actually tell you what's happening:
1. Revenue Per Cover
Total sales divided by number of covers (customers served). This tells you whether high revenue is coming from more customers or higher spend per customer — two very different situations that call for different responses.
If Outlet 1 has revenue per cover of ₹480 and Outlet 2 is ₹310, that's not just a curiosity. It's a question: is Outlet 2's menu priced differently? Is upselling not happening? Is a different customer type walking in?
2. Food Cost Percentage
Food cost as a percentage of revenue. Healthy range for most Indian restaurants: 28–35%. Above 38% and something is wrong — over-portioning, supplier price creep, theft, or waste.
The issue with tracking this per outlet is you need both sales data and purchase/inventory data in one place. Most manual setups can't do this cleanly.
3. Average Order Value (AOV)
Total revenue divided by number of orders. Watching this per outlet over time shows you whether menu changes, promotions or staff training are actually moving the needle.
If you run a promotion at Outlet 3 and AOV doesn't change, the promotion isn't working as intended. If it drops, you're cannibalising full-price orders.
4. Table Turnover Rate
How many times each table is occupied per service. Low turnover at a normally busy outlet usually points to a kitchen bottleneck or slow service — both of which cost money even when the till looks fine.
5. Shift-Level Sales
Breaking revenue down by shift (morning, afternoon, evening) per outlet shows you where the real demand is. Many owners are staffing lunch shifts at the same level as dinner when the dinner shift is doing 4x the volume. That's a direct labour cost problem hiding in an aggregated daily total.
What a Real Multi-Outlet Dashboard Should Show You
A good multi-outlet view doesn't require you to pull reports or call managers. It shows you — in real time or at the start of your day — a side-by-side comparison of every outlet across the metrics that matter.
What you should be able to do from a single screen:
- Compare yesterday's sales across all outlets at a glance
- Drill into any outlet to see order-level detail
- See which outlet's food cost is trending up this week
- Check whether a new menu item is performing differently across locations
- Spot which outlet is down vs. the same day last week
If you're opening spreadsheets to answer any of these questions, you don't have real visibility. You have data you're turning into visibility manually — and that's where things get missed.
How Setu POS Gives You Outlet-by-Outlet Visibility
Setu POS is built for multi-outlet restaurant operations. Every outlet runs on the same system, so sales, orders and performance data flow into one dashboard automatically — no consolidation, no manual exports.
You can see per-outlet revenue, order count and performance from one screen. When one location has a bad day, you know before your manager calls you. When a new dish is selling differently across outlets, you see it in the data, not in a conversation three days later.
If you're managing more than one restaurant outlet and you're still relying on EOD reports and phone calls, the problem isn't your team — it's the setup.
Frequently asked questions
Track revenue, cost and contribution per outlet — not just total sales. A high-revenue outlet can be your least profitable once its rent, staff and food cost are set against its own covers.
More from Operations
Setu vs Marg ERP: Free Tools or a Licensed Retail ERP in 2026?
Marg ERP editions are publicly listed from about ₹5,550 to ₹26,000 exclusive of tax in October 2026, and the listings disagree on whether that is yearly or one-time. Setu's retail tools are free browser pages. Here is exactly where the line falls.
Read more →
Setu vs Swipe: Free Invoicing Tools or a Billing Account in 2026?
Swipe's paid plans start near ₹2,542 a year excluding GST as publicly listed in October 2026, and it keeps a free app tier. Setu's invoicing tools are free browser tools with no account and no sync. Here is exactly where the line between them falls.
Read more →
Setu vs myBillBook: Counter Billing and Stock for a Small Shop in 2026
myBillBook puts billing, stock and khata in one paid account, listed from ₹3,490 a year with a trial but no permanently free tier. Setu's billing, stock register and ledger tools are free with no cap. Here is how to tell which trade fits your shop.
Read more →
Setu vs Refrens: Quoting and Invoicing for a Service Business in 2026
Refrens is a real quote-to-payment platform for Indian service businesses, free to 15 documents and priced from ₹7,080 a year after that. Setu's quotation and invoice tools are free with no cap. Here is how to tell which trade fits your business.
Read more →