Menu Engineering in 2026: Why 15-25% of Your Menu Is Quietly Losing Money (And Your POS Already Has the Data to Fix It)
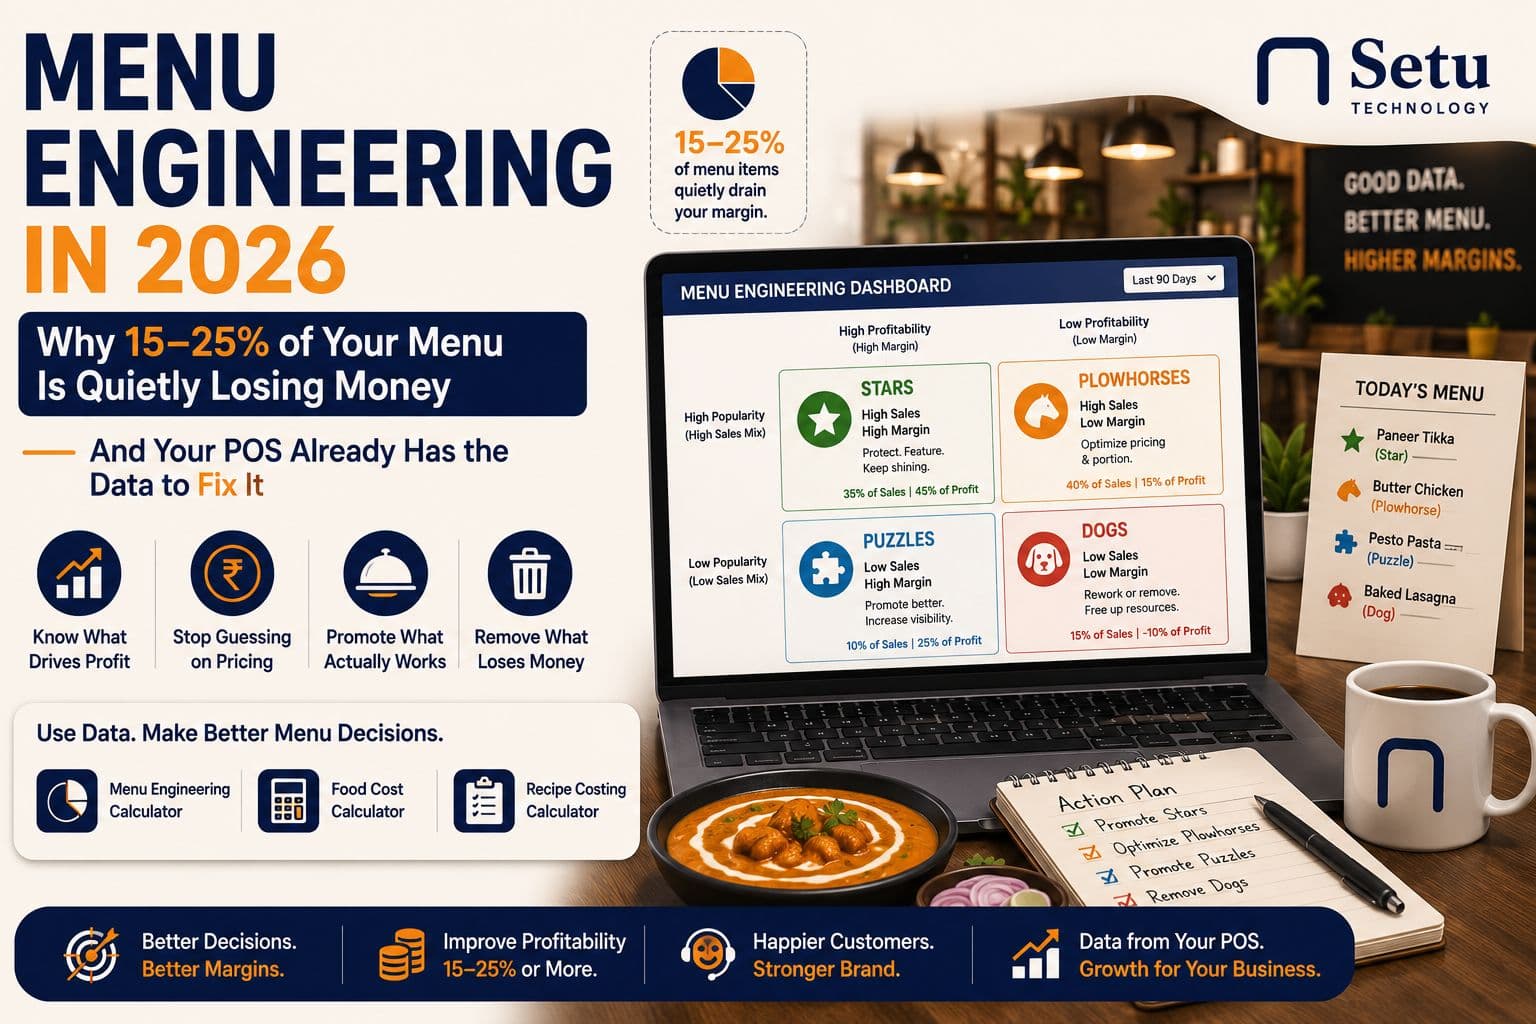
Ask any restaurant owner what their bestseller is and they'll answer in half a second. Ask them which items on the menu are actually losing money and most go quiet. That gap — between what sells and what's profitable — is where a huge amount of margin disappears every month, and almost none of it shows up as a line item anyone notices. It just looks like "food cost is a bit high this quarter."
Menu engineering is the fix, and in 2026 it's no longer a once-a-year exercise done by a consultant with a spreadsheet. Every POS already captures the sales data needed to do it — most restaurants just aren't looking at it the right way.
The four boxes every menu item falls into
Menu engineering sorts every dish on two axes: how popular it is (sales mix) and how profitable it is (contribution margin, i.e. price minus food cost). That gives four categories:
- Stars — high popularity, high margin. Protect these. Feature them. Never discount them.
- Plowhorses — high popularity, low margin. Customers love them, but they're barely paying their way. Usually your butter chicken, your biryani, your house dal. Small price or portion adjustments here move real money.
- Puzzles — high margin, low popularity. Profitable but hidden. Often fixable with better menu placement, a server nudge, or a photo.
- Dogs — low popularity, low margin. Quietly costing you shelf space, prep time, and inventory complexity. Usually the first candidates to cut.
Most restaurants intuitively know their Stars. Almost none know their Dogs, because nobody sits down with 90 days of item-level sales and food-cost data and actually does the math. It's tedious by hand — which is exactly why it gets skipped.
Why this keeps getting skipped in Indian restaurants
Three reasons show up again and again when operators are asked why they haven't run this exercise:
- Food costing isn't kept current. Recipe costs are set once when the menu launches and rarely revisited, even as raw material prices move month to month.
- Sales data and cost data live in different places. The POS knows what sold. A separate spreadsheet (if it exists at all) knows what things cost. Nobody joins the two.
- It feels like a big project. Owners picture a multi-day audit, so it gets pushed to "next quarter" indefinitely — and next quarter never comes.
None of these are really about effort. They're about the data being scattered instead of sitting in one dashboard an owner can glance at between shifts.
What your POS is already sitting on
If your POS logs item-level sales — which almost every modern system does — you already have the popularity half of the equation. The missing piece is almost always food costing per item, and that's a one-time setup, not a recurring chore. Once recipe costs are attached to menu items, the classification is just arithmetic: sales mix percentage against contribution margin, sorted into the four boxes.
This is where a lot of restaurants find that the POS they picked for billing speed never really built out this layer. Petpooja covers reporting reasonably well for single-outlet operators but menu-level profitability views are limited without add-ons. Restroworks (POSist) does centralized analytics well, but it's built and priced for 10+ outlet chains, which is overkill if you're running two or three locations. Gofrugal leans more retail-first, with restaurant menu analytics as a secondary feature rather than the core design. None of this makes them bad systems — it just means menu profitability often ends up as a manual side project regardless of which POS is running the counter.
Running the exercise in an afternoon
You don't need a consultant or a new tool to start. Here's the version that fits into one sitting:
- Pull 60–90 days of item-level sales. Enough to smooth out a slow week or a one-off event, not so much that seasonal dishes get buried.
- Attach a food cost to every active item. Even rough costing (ingredients only, no labor) is good enough to start — precision can come later.
- Calculate contribution margin per item (price minus food cost) and sales mix (that item's share of total items sold).
- Plot every item into the four boxes using your menu's average margin and average sales mix as the dividing lines.
- Act on the extremes first. Reposition or gently reprice your Plowhorses. Cut or bundle your Dogs. Push your Puzzles higher on the menu or into server recommendations. Leave your Stars alone.
Operators who run this properly typically find 15–25% of an active menu sitting in the Dog quadrant — items that are neither selling well nor making money, but are still being prepped, stocked, and photographed. Trimming even half of that list frees up kitchen bandwidth without touching top-line sales.
A worked example
Take a mid-sized casual dining menu with 80 active items. Average contribution margin across the menu works out to ₹180 per dish, and average sales mix is 1.25% (100% divided by 80 items). A butter chicken priced at ₹320 with a food cost of ₹110 has a margin of ₹210 — above average — and sells at 4% of total volume, well above the 1.25% baseline. That's a clear Star, and the temptation to raise its price to "capture more margin" is exactly the move to resist, since it's already both popular and profitable.
Now take a paneer starter priced at ₹280 with a food cost of ₹150. Margin is ₹130, below average, but it still sells at 3% of volume — a Plowhorse. Here a ₹20–30 price adjustment, or trimming the portion by one piece, recovers real margin without customers noticing much, because the dish was never priced on its actual cost structure to begin with, it was priced to "feel right" next to similar items on the menu.
Two mistakes that undo the exercise
The first is doing it once and never again. Ingredient prices move, especially with edible oil, dairy, and vegetable price swings that hit Indian kitchens through the year. A margin classification from January can be wrong by July. Menu engineering works best as a quarterly check, not an annual event.
The second is treating it as a pricing exercise only. The instinct is to raise prices on Plowhorses across the board. Customers notice sudden price jumps on their favourite dish faster than almost anything else on the menu. Smaller, staggered adjustments — or a portion tweak instead of a price change — tend to hold up better than a blunt increase.
Menu placement matters as much as pricing
Once items are classified, half the work is repositioning rather than repricing. Puzzles — profitable but overlooked — usually move the needle fastest when they're pulled out of a crowded middle section and placed where eyes actually land: top of a category, next to a Star, or flagged as a server recommendation. On QR and digital menus this is even easier to test, since a photo or a "chef's pick" tag can be added or removed without reprinting anything, and the sales mix shift can be checked against the POS within a week instead of waiting for a quarterly review.
Where this fits with the rest of your operations
Menu profitability doesn't sit in isolation. It connects directly to two things covered elsewhere on this blog: inventory leakage, since Dogs are usually the items driving unnecessary stock complexity, and aggregator payout reconciliation, since delivery platforms often surface different bestsellers than your dine-in floor — which can mean two different menu engineering exercises for two different channels.
The point isn't to turn every restaurant owner into a data analyst. It's to stop guessing. The sales data already exists in your POS. The only missing input is food cost per item, and that's a setup task, not a monthly grind. Once it's in place, the four boxes tell you exactly where to spend your next hour of attention — instead of it going to whichever dish someone complained about last week.
Frequently asked questions
It's classifying every menu item by profitability and popularity into Stars, Puzzles, Plowhorses and Dogs, then using that to decide what to promote, reprice, rework or remove.
More from Menu Ops

Bar Maths: Pour Cost, Cocktail Costing and Pricing Drinks That Pay
A bar loses money quietly: a few extra millilitres a pour and nothing on the bill ever looks wrong. This walks through pours per bottle, cocktail costing, pricing in rupees rather than percentages, and the variance check that catches the rest.
Read more →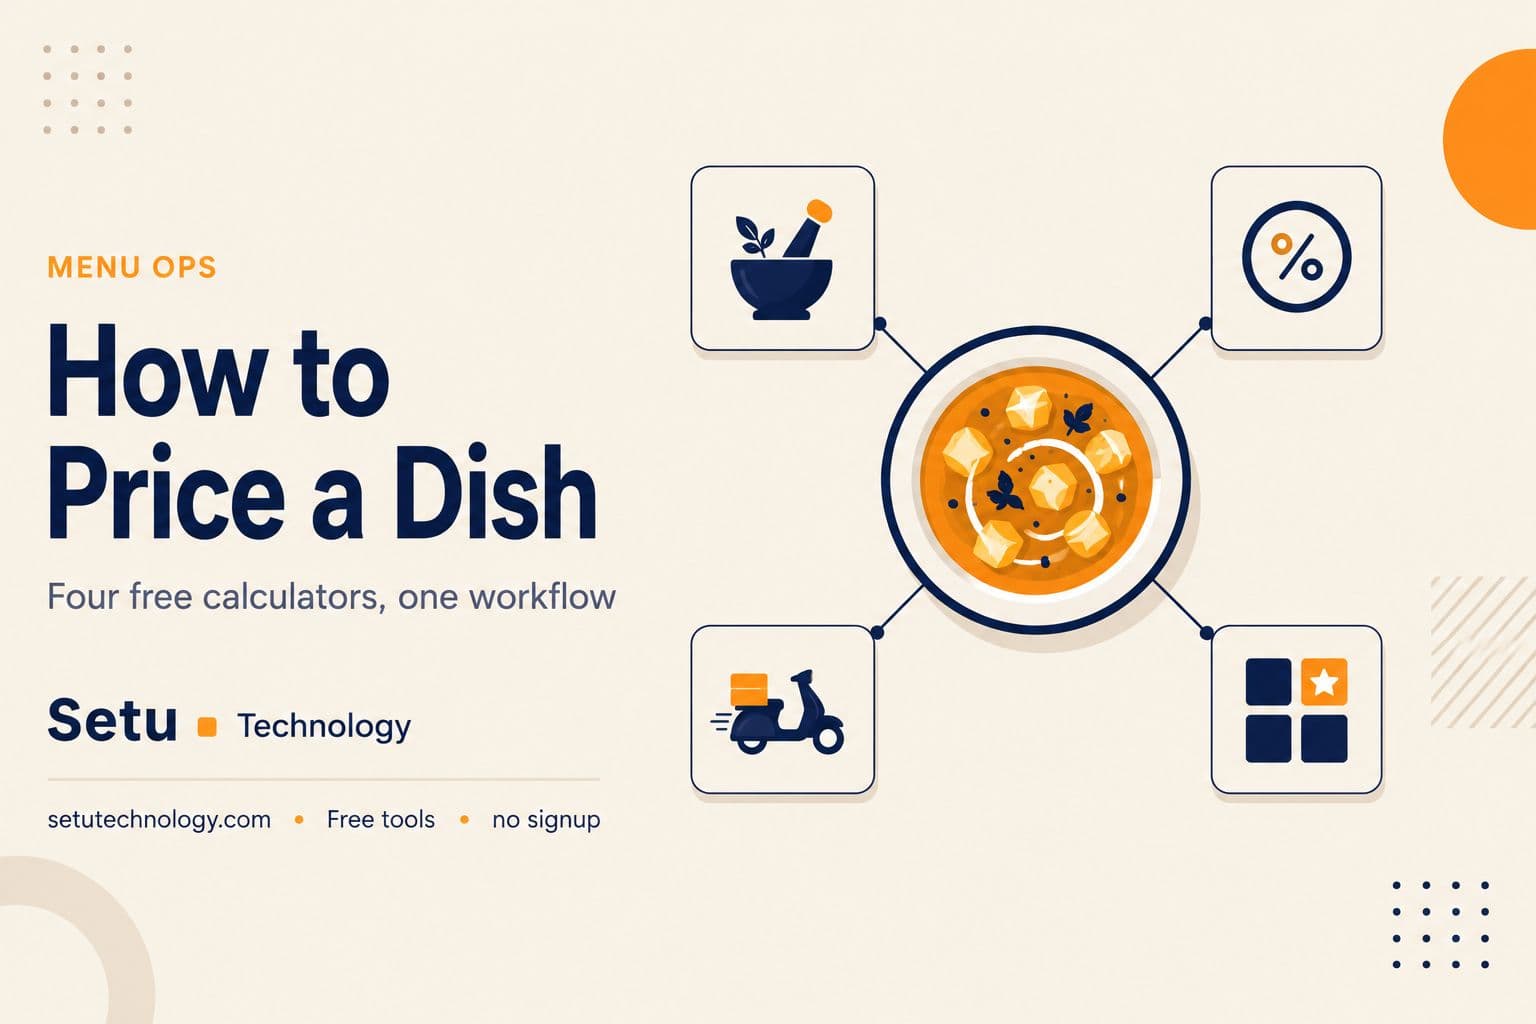
How to Price a Dish in 2026: Four Free Calculators, One Workflow
Most menu prices are set by copying the restaurant down the road or multiplying ingredient cost by three. Here's the four-calculator sequence that tells you why a price works — costing, food cost, aggregator pricing and menu engineering.
Read more →
MenuTiger Charges $17/Month for a QR Code Menu. Here's What You Get for Free Instead.
MenuTiger's free plan gives you 49 items and 200 orders before it pushes you to a $17/month plan. Setu's QR Menu Generator skips the hosting entirely — the whole menu lives inside the QR code itself. Here's an honest comparison of what each actually does.
Read more →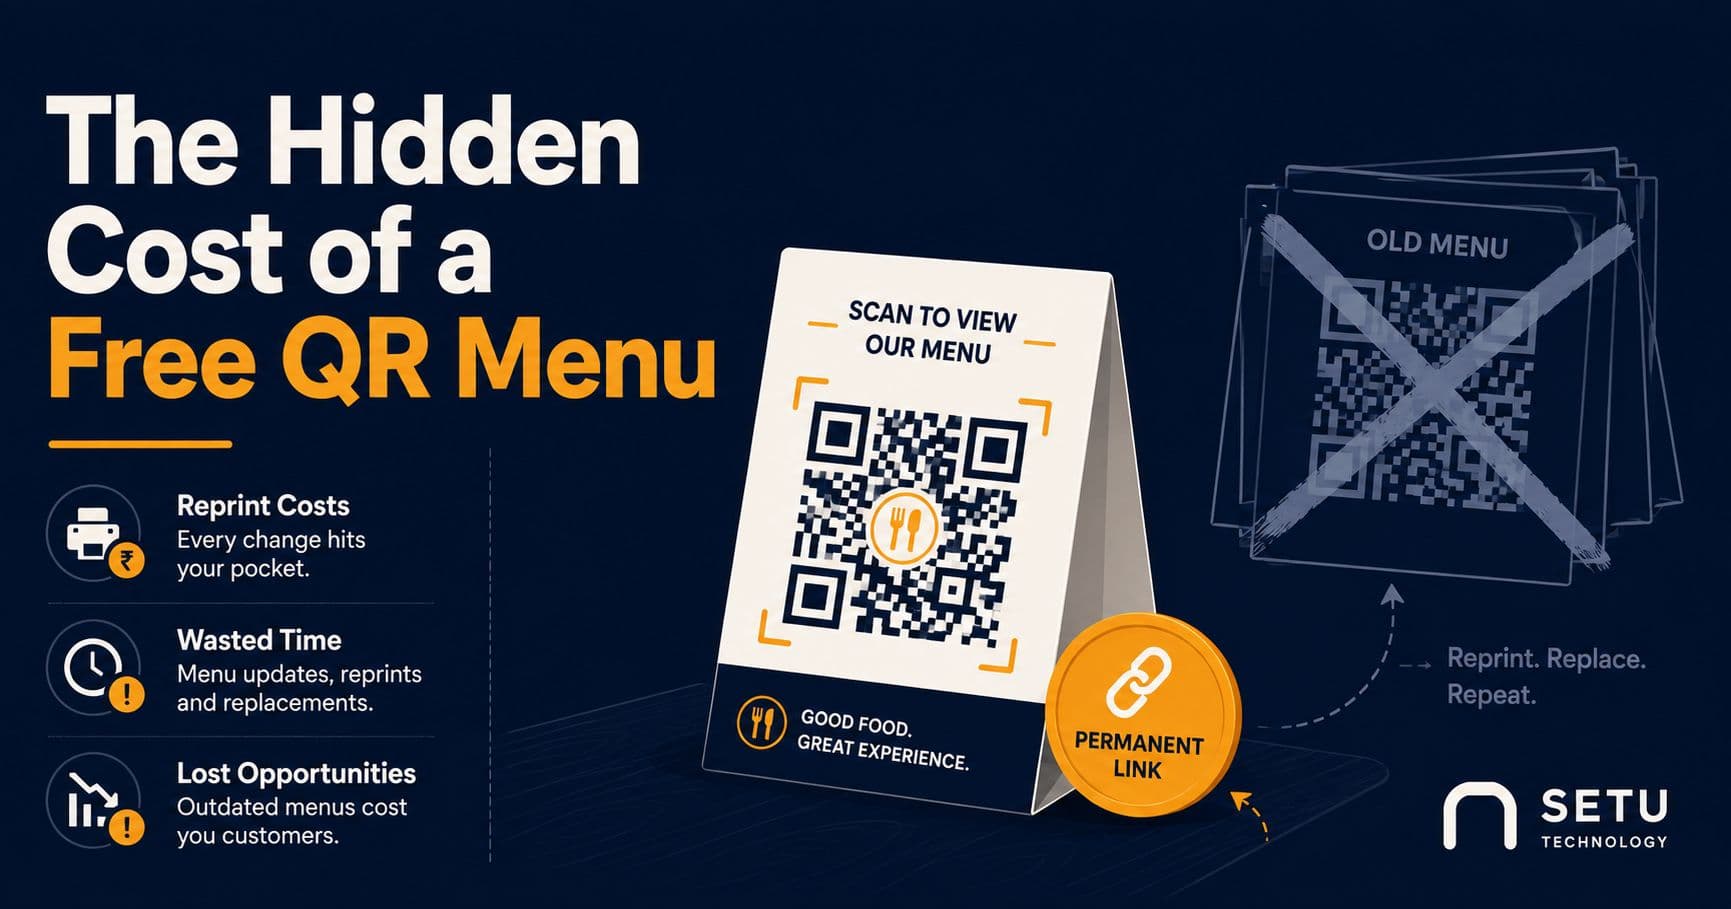
The Hidden Cost of a Free QR Menu in 2026: Every Price Change Means Reprinting Every Code
A free QR menu that packs your whole menu inside the code is brilliant until your first price change. Here's why 2026's ingredient price swings are exposing that gap, and how a permanent-link QR code fixes it without losing the free tool you started with.
Read more →