Bar Maths: Pour Cost, Cocktail Costing and Pricing Drinks That Pay
Ask a restaurant owner what their food cost is and most will give you a number. Ask what their bar costs them and the answer tends to be vaguer, which is odd, because the bar is usually the highest-margin thing in the building and the easiest to lose money in quietly. A kitchen loses a little on every plate. A bar loses a lot on a few pours, and nothing on the bill ever looks wrong.
This is a walk through the arithmetic, using three free calculators to do the work. Nothing here needs a spreadsheet, and the whole exercise on your top ten drinks takes about an hour.
Start with the only number that matters: pours per bottle
Every bar calculation sits on top of one figure, and it is the figure most often guessed. A 750ml bottle at a 30ml peg measure is twenty-five pours. At 60ml it is twelve and a half. A 1 litre bottle at 30ml is thirty-three and a third.
Those are the theoretical numbers, and you will not get them. Between the last pour that does not fill a measure, what clings to the bottle, and the small overpour that happens when a bar is three deep, the realistic yield is lower. Planning on twenty-three or twenty-four pours from a 750ml bottle at 30ml is closer to what actually happens, and the gap between twenty-five and twenty-three is eight percent of your liquor cost. That is not a rounding error, it is the difference between a healthy bar and a puzzling one.
Decide your working yield before you price anything, write it down, and use the same figure everywhere. Half the bars that cannot explain their numbers are using twenty-five in the pricing spreadsheet and getting twenty-two at the counter.
Step one: pour cost on a straight spirit
Open the Liquor Pour Cost Calculator and give it four things: what the bottle costs you, the bottle size, the pour size you actually serve, and what you sell the drink for. It returns pour cost percentage, profit per pour and pours per bottle.
Work a real example. A bottle costs ₹1,800 for 750ml. You pour 30ml and sell at ₹320. Cost per pour is 1,800 ÷ 25, which is ₹72. Against a ₹320 selling price that is a pour cost of 22.5 percent and a gross profit of ₹248 a drink.
Now run the same bottle at a realistic yield of twenty-three pours. Cost per pour becomes ₹78.26, pour cost rises to 24.5 percent, and profit falls to ₹241.74. Same bottle, same price, same menu — two points of margin that only exist in the spreadsheet.
Do this for every straight spirit on the list before you touch cocktails. It is the fastest part and it usually finds one or two lines priced from memory years ago.
Step two: cocktails, where the money actually goes
A cocktail is a recipe, so it needs recipe arithmetic. The Recipe Costing Calculator takes every ingredient with its quantity and unit cost and returns a total cost per serve.
Cost everything, not just the spirit. A margarita is tequila, triple sec, lime juice, salt and ice — and the lime is not free, particularly when limes do what limes do in summer. Garnishes, syrups, bitters and the straw all belong in the number. Each is trivially small; together they routinely add fifteen to twenty-five percent on top of the spirit cost, and a bar that costs only the spirit is systematically pricing its cocktails too low.
Two things that get missed. First, juice and syrup yields: a kilo of limes does not give you a kilo of juice, so cost the juice at what the juice actually costs, not what the fruit cost. Second, batch prep — if you make a syrup or a mix in advance, cost the batch once and divide by servings, and include the portion you throw away at the end of the week.
Step three: turn cost into a price you can defend
With a cost per serve, the Profit Margin Calculator closes the loop. Enter the cost and the price you are considering and read the margin, or work backwards from the margin you need.
Resist the temptation to apply one target across the whole list. The honest position is that there is no universal correct pour cost. The traditional benchmark is a combined beverage cost somewhere around 18 to 22 percent, but that figure was coined for a different kind of bar in a different market, and practitioners now report craft-led bars running comfortably in the low to mid twenties while high-volume venues sit lower. Both can be profitable, because a percentage is not money.
That last point is worth sitting with. A beer at 15 percent pour cost on a ₹200 price earns you ₹170. A cocktail at 26 percent on a ₹650 price earns you ₹481. The cocktail has the worse percentage and is nearly three times better for the business. Percentages are for spotting drift over time; rupees per drink are for deciding what to put in front of a guest.
Step four: the gap between theory and the till
Everything above is theoretical cost: what the drinks you sold should have consumed. Actual cost is what the bar actually went through, and the difference between the two is bar variance. It is the number that catches the problems pricing cannot.
The arithmetic is plain. Opening stock plus purchases minus closing stock gives you what was consumed in the period. Value it, divide by beverage sales for the same period, and you have actual pour cost. Compare it with the theoretical pour cost your recipes predict.
A gap of a point or so is normal and not worth chasing. A gap of three or four points is money leaving the building, and there are only a handful of explanations: consistent overpouring, drinks poured and never rung up, breakage and spillage nobody recorded, comps and staff drinks outside the system, a house pour that is quietly a premium brand, or stock walking out of the door. Keeping an honest count in a Stock Register is what makes the comparison possible at all — without a reliable closing stock there is no actual cost and the whole exercise stops at theory.
Count weekly if you can, at least for spirits. A monthly count tells you something went wrong somewhere in thirty days, which is rarely actionable. A weekly count tells you which week, and usually that is enough to tell you which shift.
What to do with what you find
The usual pattern after a first pass is four or five drinks priced too low because a supplier price rose and the menu did not, one drink with an invisible garnish cost, and a variance gap that points at measurement rather than theft. That order is worth respecting: fix pricing first because it is immediate and costs nothing, then fix measurement, and only then go looking for a person.
On measurement, the cheapest control in any bar is a jigger used consistently. Free-pouring is a trained skill and most staff overestimate how good they are at it; the overpour is usually in the direction of generosity, which is lovely for the guest and expensive at volume. If you change nothing else after reading this, measure a few free-poured drinks against a jigger and see what the actual pour size is.
Then put a date in the calendar. Rerun the top ten drinks whenever a supplier price list changes, and at minimum once a quarter. Costing is not a project you finish; it is a thing that goes stale. The same logic applies on the food side, and the guide to pricing a dish walks the kitchen version of this exercise.
The hour, in order
Decide your working pours per bottle. Run every straight spirit through the pour cost calculator. Cost your top five cocktails ingredient by ingredient, garnish included. Check each resulting margin in rupees, not just percent. Then count your bar for one week and compare actual against theoretical. That is the whole method, and it is roughly an hour for a list of thirty drinks once you have the supplier prices to hand.
If the count is the part that never happens, that is usually a bookkeeping gap rather than a bar one, and Setu's consultancy covers that side of the business inside whichever system you already run.
Frequently asked questions
There is no single right answer, and anyone who gives you one without asking about your venue is guessing. The long-standing benchmark is a combined beverage cost of roughly 18 to 22 percent, but that was coined for a particular kind of bar, and craft-led venues frequently run in the low to mid twenties while profitable high-volume bars run lower. Your own trailing range is far more useful than an industry figure, because it turns an unusual month into a signal.
More from Menu Ops
How to Price a Dish in 2026: Four Free Calculators, One Workflow
Most menu prices are set by copying the restaurant down the road or multiplying ingredient cost by three. Here's the four-calculator sequence that tells you why a price works — costing, food cost, aggregator pricing and menu engineering.
Read more →
MenuTiger Charges $17/Month for a QR Code Menu. Here's What You Get for Free Instead.
MenuTiger's free plan gives you 49 items and 200 orders before it pushes you to a $17/month plan. Setu's QR Menu Generator skips the hosting entirely — the whole menu lives inside the QR code itself. Here's an honest comparison of what each actually does.
Read more →
The Hidden Cost of a Free QR Menu in 2026: Every Price Change Means Reprinting Every Code
A free QR menu that packs your whole menu inside the code is brilliant until your first price change. Here's why 2026's ingredient price swings are exposing that gap, and how a permanent-link QR code fixes it without losing the free tool you started with.
Read more →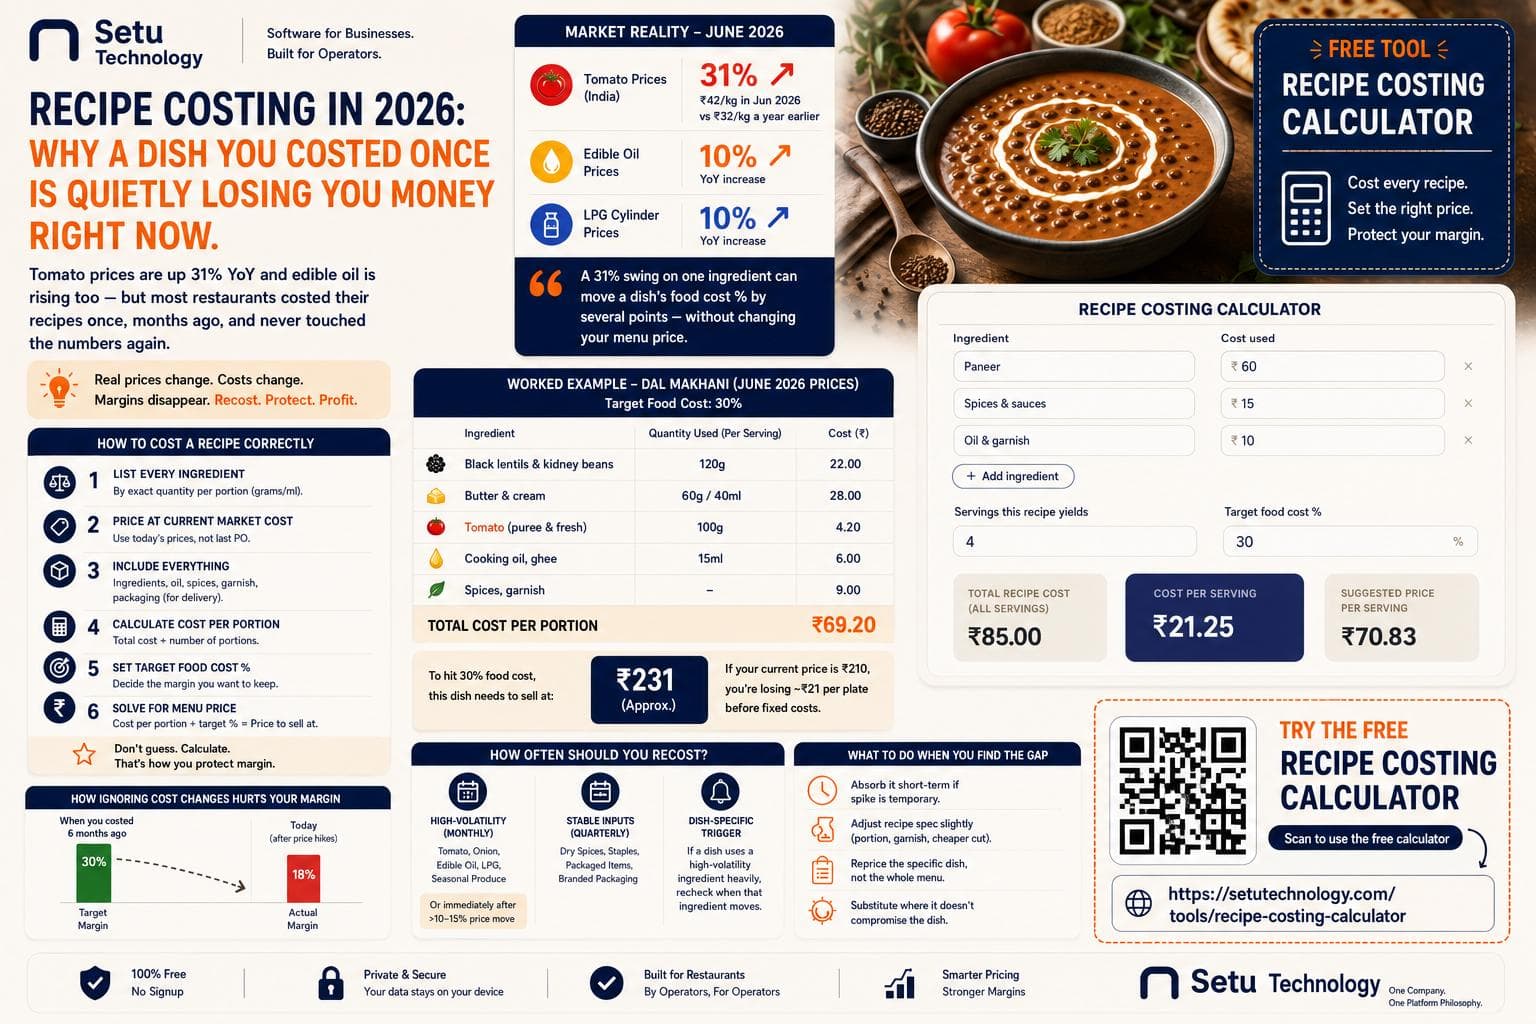
Recipe Costing in 2026: Why a Dish You Costed Once Is Quietly Losing You Money Right Now
Tomato prices are up 31% year-on-year and edible oil is climbing too - but most restaurants costed their recipes once, months ago, and never touched the numbers again. Here's how to fix that.
Read more →