How to Price a Dish in 2026: Four Free Calculators, One Workflow
Most menu prices in India are set one of three ways: copy the restaurant down the road, multiply the ingredient cost by three, or pick a number that "feels right" and end in a 9.
All three can accidentally work. None of them tell you why they worked, which means none of them tell you what to do when paneer goes up ₹60 a kilo in April.
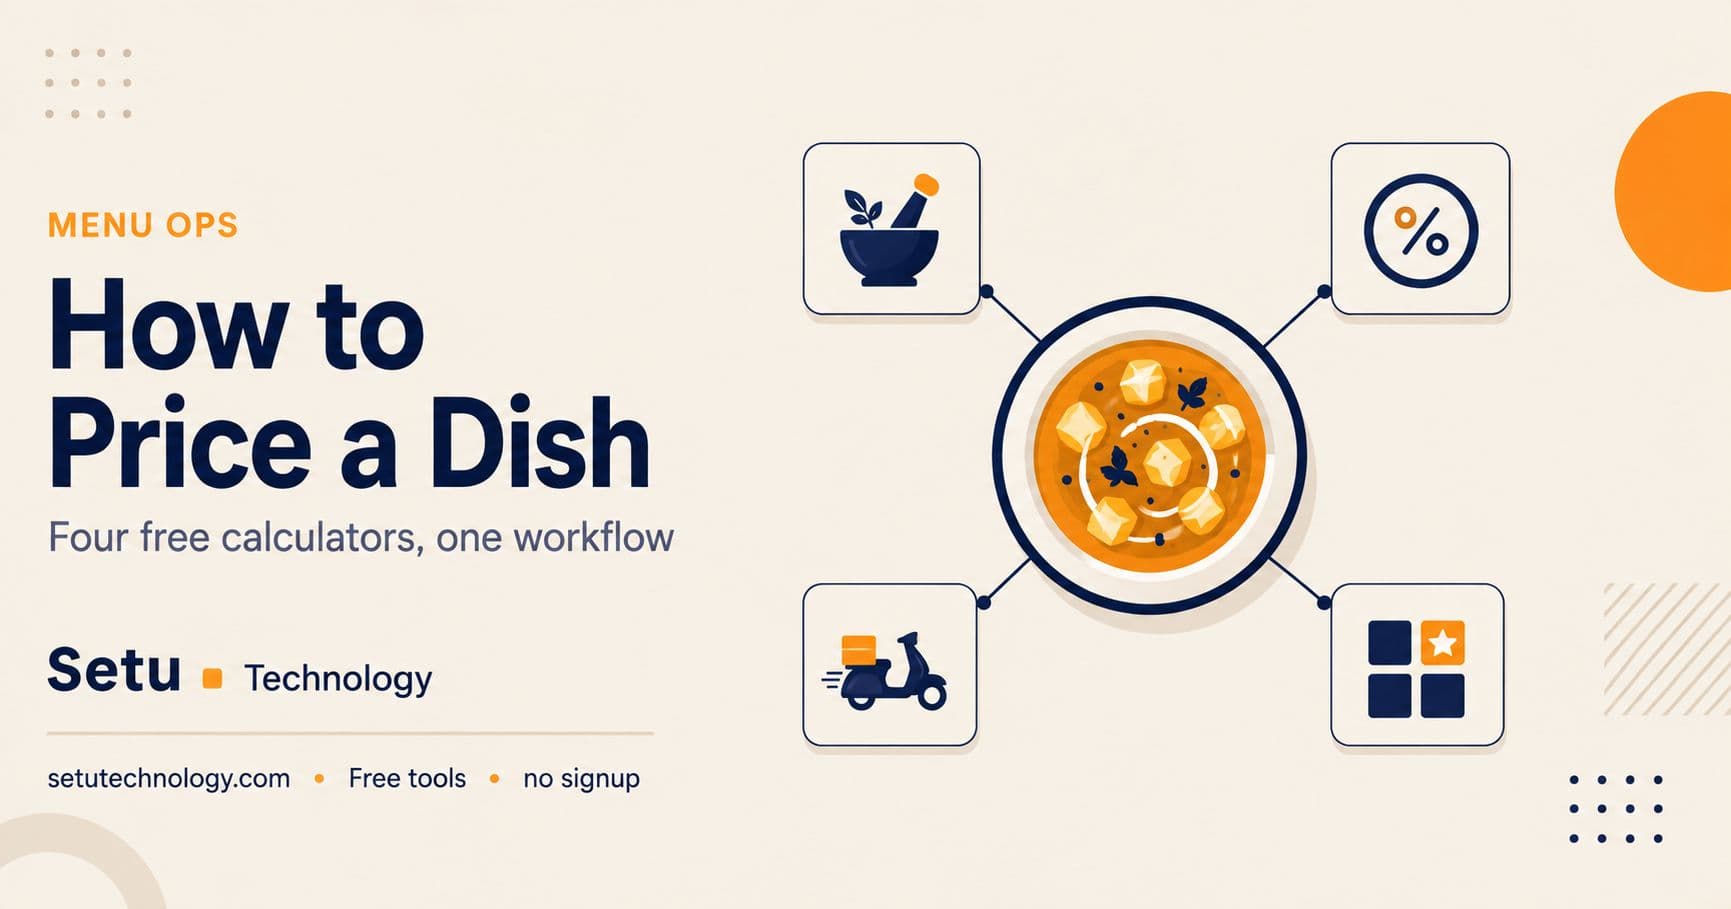
There is a better sequence, and it takes about twenty minutes per dish the first time. Four free calculators, in order, each answering one question:
- Recipe Costing Calculator — what does one plate cost me?
- Food Cost Calculator — is the price I picked actually healthy?
- Online Menu Price Calculator — what must I list on Zomato and Swiggy to end up in the same place?
- Menu Engineering Calculator — is this dish earning its slot on the menu?
Do them in that order. Skipping step 1 makes the rest guesswork; skipping step 4 means you never find out you were wrong.
Step 1: Cost the recipe, not the ingredient list
The number you need is plate cost — what it costs to put one serving in front of a customer — and you get it from a batch, not from a single portion. Nobody makes one portion of gravy.
Open the Recipe Costing Calculator. Its fields are deliberately plain:
- Ingredient and Cost used (₹) — the rupee value of what actually goes into the batch, not what the sack cost
- Servings this recipe yields — the honest number, after the chef has tasted it
- Target food cost % — the discipline you're holding yourself to
Two things people get wrong here.
Cost what you use, at landed cost. If you buy paneer at ₹420/kg including delivery and use 800g, the entry is ₹336, not ₹420. And if your supplier price moved last week, use last week's price — recipe costing against a three-month-old rate is fiction. (We wrote about surviving ingredient price swings here.)
Yield is where the money leaks. The calculator asks how many servings the batch yields; it does not adjust for trim, peel, cooking loss or the ladle that's 10% generous. If a 1kg chicken yields 700g usable, your real cost per usable kilo is your purchase price divided by 0.7 — that's yield percentage doing its work. Do that arithmetic before you type the number in, or run a Stock Register count for a week and back into your true yield. This is also why portion control is a costing issue and not just a kitchen discipline one.
Worked example — Paneer Butter Masala, batch of 8:
| Ingredient | Quantity used | Rate | Cost used |
|---|---|---|---|
| Paneer | 800 g | ₹420/kg | ₹336.00 |
| Butter | 120 g | ₹560/kg | ₹67.20 |
| Fresh cream | 200 ml | ₹280/L | ₹56.00 |
| Tomato | 1.2 kg | ₹40/kg | ₹48.00 |
| Cashew | 80 g | ₹850/kg | ₹68.00 |
| Onion | 400 g | ₹35/kg | ₹14.00 |
| Oil / ghee | 60 ml | — | ₹18.00 |
| Spices and aromatics | — | — | ₹35.00 |
| Total batch cost | ₹642.20 |
Servings: 8. Cost per serving: ₹80.28.
At a target food cost of 30%, the calculator suggests ₹80.28 ÷ 0.30 = ₹267.60. Round to ₹269 — that rounding is psychological pricing, and it's worth the ₹1.40.
Step 2: Check the food cost percentage
Step 1 gave you a price derived from a target. Step 2 checks the target was sane, and gives you the number you'll actually track month to month.
The Food Cost Calculator wants two things: Ingredient cost per dish and Menu selling price.
- ₹80.28 and ₹269 → food cost percentage 29.8%, and gross profit per dish ₹188.72
The tool flags a typical band of 28–35% for most restaurants, with the sensible caveat that it varies by cuisine and format. A few useful calibrations:
- Beverages and breads usually run far below the band — that's normal and it subsidises the rest
- Seafood and premium proteins often run above it, and you accept that for menu credibility
- If a dish is under 20%, you may be leaving money on the table or portioning meanly
- If it's over 45%, either the price is wrong or the recipe is
One caution: food cost percentage is not the whole margin story. A ₹59 naan at 20% food cost contributes ₹47; a ₹449 mutton dish at 45% contributes ₹244. Percentages tell you about efficiency, contribution margin in rupees tells you about profit. You need both — which is why step 4 exists. And neither of them covers labour, which is why prime cost is the number your accountant will ask about.
Step 3: Reprice for Zomato and Swiggy separately
Here is where a lot of otherwise well-run kitchens quietly lose money: they list the dine-in price on the aggregator.
Charge ₹269 on Zomato and, after commission, GST on that commission, gateway charges and packaging, you might take home ₹170. You've sold the dish at a 37% loss against your own plan without ever seeing a loss on paper.
The Online Menu Price Calculator works backwards from what you want to keep. Its fields:
- Price you want to take home (₹) — ₹269, to match dine-in
- Platform commission (%) — typically 18–25% in 2026; use your contract, not an average
- GST on commission (%) — 18%
- Payment gateway fee (%) — around 2%
- Packaging cost (₹) — ₹15 for this dish
- GST you charge on this item (%) — 5%
At a 22% commission, that comes out to a listed price of roughly ₹425:
| Line | Amount |
|---|---|
| Listed price on the platform | ₹425.00 |
| Less GST you remit (5%, inclusive) | −₹20.24 |
| Less aggregator commission (22%) + 18% GST on it | −₹110.33 |
| Less payment gateway (2%) | −₹8.50 |
| Less packaging | −₹15.00 |
| You keep | ₹270.93 |
That's a 58% markup over the dine-in price — and that gap is exactly what menu price padding means. It is standard practice, not sharp practice, but two warnings:
Sanity-check it against demand. ₹425 for paneer butter masala has to be believable next to the listings around you. If it isn't, the honest conclusion is that this dish doesn't work on aggregators at your cost base — not that you should list it at a loss and hope volume fixes it.
Verify against your actual payout report. Commission structures vary by contract, city and campaign, and the calculator says so itself. Take one week of real payouts, work backwards, and check the model. The Online Order Commission Calculator helps here, and there's more detail in Zomato & Swiggy menu pricing in 2026.
Note also: standalone restaurants in India charge 5% GST with no input tax credit under the structure effective from 22 September 2025 (18% with ITC applies in hotels with declared room tariff above ₹7,500). No ITC means the GST on your commission invoice is a real cost, not something you recover — which is precisely why it sits in the deduction stack above.
Step 4: Let the menu tell you what to fix
A dish can be priced perfectly and still be the wrong dish. Step 4 compares it against everything else you sell.
The Menu Engineering Calculator takes Item Name, Price, Cost, Units Sold for each item, then plots every dish against the menu's own averages. Setu's labels for the four quadrants:
- Stars — high margin, high popularity. Promote these.
- Cash Cows — high margin, low popularity. Increase visibility. (Classic menu engineering texts call these Puzzles.)
- Puzzles — low margin, high popularity. Raise the price or cut the cost. (Classically, Plowhorses.)
- Dogs — low margin, low popularity. Remove or reposition.
Run a month of data:
| Item | Price | Cost | Units | Margin % | Contribution | Verdict |
|---|---|---|---|---|---|---|
| Butter Naan | ₹59 | ₹12 | 1,240 | 79.7% | ₹58,280 | Star |
| Dal Tadka | ₹189 | ₹38 | 510 | 79.9% | ₹77,010 | Cash Cow |
| Paneer Butter Masala | ₹269 | ₹80 | 620 | 70.3% | ₹117,180 | Puzzle |
| Veg Biryani | ₹249 | ₹96 | 180 | 61.4% | ₹27,540 | Dog |
| Mutton Rogan Josh | ₹449 | ₹205 | 95 | 54.3% | ₹23,180 | Dog |
Average margin across the menu: 71.5%. Average units: 529.
And there's the surprise. Paneer butter masala — the dish we costed carefully and priced correctly — comes out a Puzzle, because 70.3% sits just under the menu's 71.5% average while it sells well above average volume. It is the single biggest contributor on the menu in rupees, and it is dragging the average down.
That is a useful problem, and it has cheap fixes:
- ₹269 → ₹289 lifts margin to 72.3% and, at the same volume, adds about ₹12,400 a month. A ₹20 move on a ₹269 dish rarely dents demand.
- Or take ₹5 out of the plate cost — trim the cashew paste ratio, renegotiate paneer at 620 units a month of volume, tighten the cream ladle. Same effect, no price change.
- Do both and you've moved your highest-volume dish into Star territory without touching anything else.
Meanwhile, mutton rogan josh at 95 units and 54.3% margin is the classic keep-or-kill call. It might be earning its place as a credibility dish that anchors the price ladder and makes ₹269 look reasonable. It might just be wasting prep space and tying up dead stock in the freezer. The calculator won't decide that — but it will stop you from pretending the question doesn't exist.
Export the result and re-run it quarterly. Menu mix shifts on its own even when you change nothing.
The three mistakes this workflow prevents
Pricing off the ingredient bill instead of the plate. Ignoring yield, trim and over-portioning routinely understates plate cost by 10–20%. Everything downstream inherits that error.
Running one price across all channels. Dine-in, takeaway and aggregator have completely different cost stacks. One price cannot serve all three, and the aggregator is always the one that eats the difference.
Setting a price once. Prices are decisions with an expiry date. Ingredient rates move, commissions get renegotiated, and your menu mix drifts. Re-cost your top ten dishes quarterly; it's an hour, and it is usually the highest-return hour of the quarter.
If re-costing by hand every quarter is the part that won't happen, that's the gap Setu Dine closes — it holds recipe costs against live ingredient prices and your actual sales mix, so steps 1, 2 and 4 stay current without a spreadsheet session. The calculators will always be free either way.
Frequently asked questions
28–35% works for most full-service restaurants, but it's a band, not a rule. Judge it by category: breads and beverages should sit well below, premium proteins above. What matters more is that the number is stable month to month — a food cost that moves 5 points between months is telling you about wastage or theft, not about pricing.
More from Menu Ops
Bar Maths: Pour Cost, Cocktail Costing and Pricing Drinks That Pay
A bar loses money quietly: a few extra millilitres a pour and nothing on the bill ever looks wrong. This walks through pours per bottle, cocktail costing, pricing in rupees rather than percentages, and the variance check that catches the rest.
Read more →
MenuTiger Charges $17/Month for a QR Code Menu. Here's What You Get for Free Instead.
MenuTiger's free plan gives you 49 items and 200 orders before it pushes you to a $17/month plan. Setu's QR Menu Generator skips the hosting entirely — the whole menu lives inside the QR code itself. Here's an honest comparison of what each actually does.
Read more →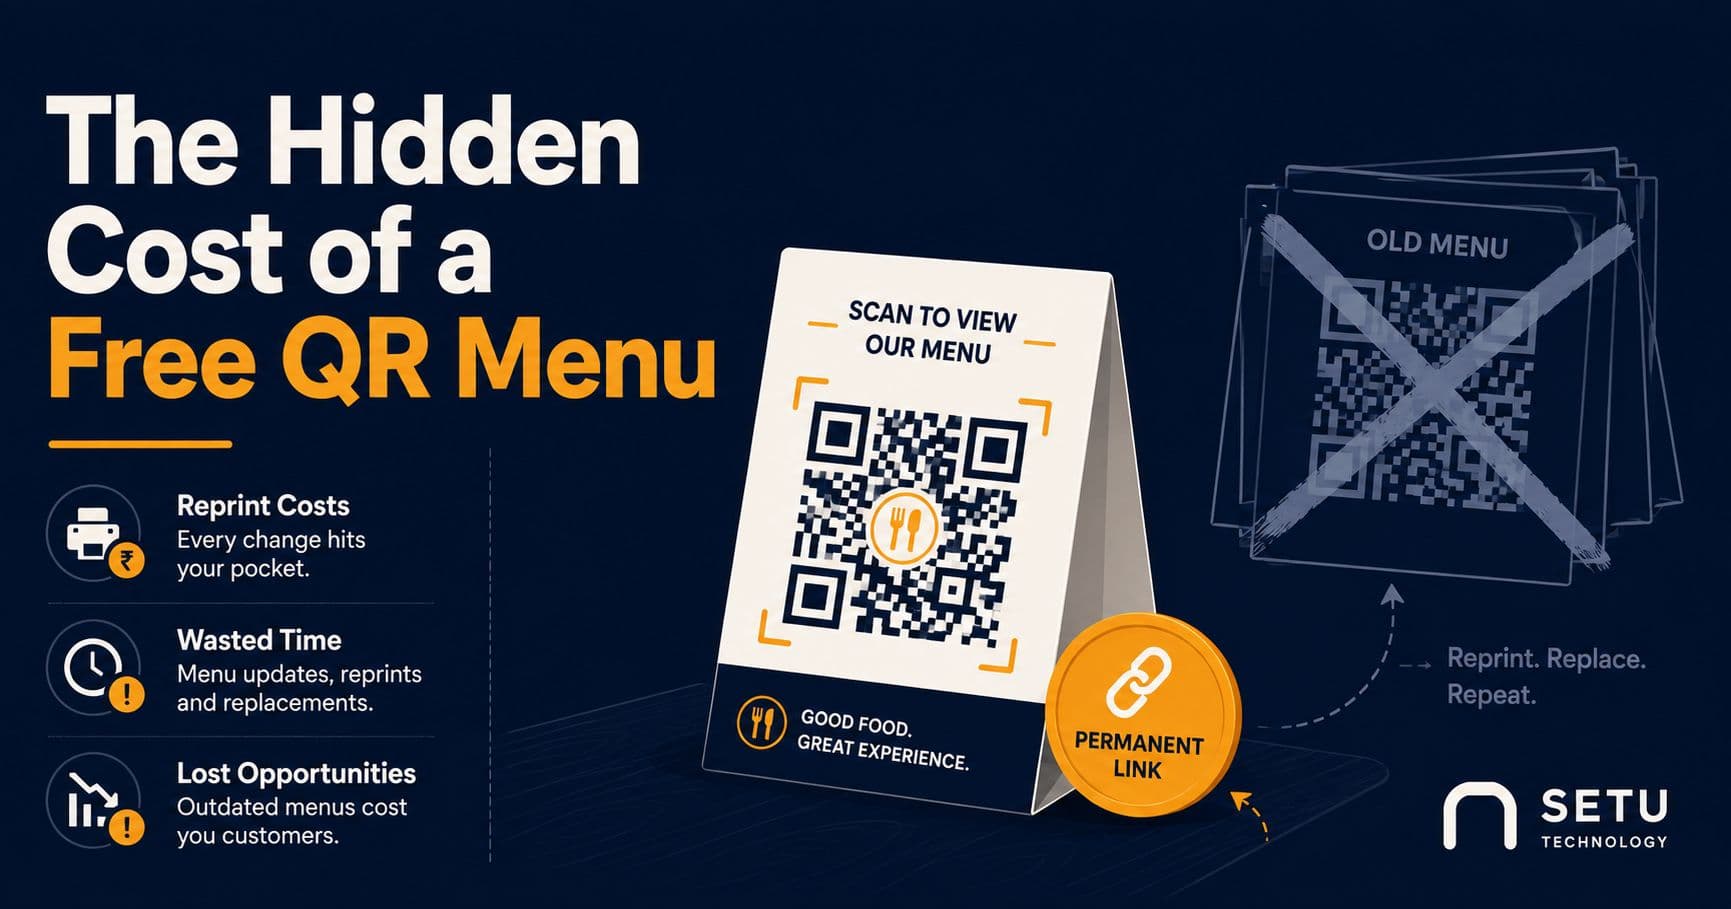
The Hidden Cost of a Free QR Menu in 2026: Every Price Change Means Reprinting Every Code
A free QR menu that packs your whole menu inside the code is brilliant until your first price change. Here's why 2026's ingredient price swings are exposing that gap, and how a permanent-link QR code fixes it without losing the free tool you started with.
Read more →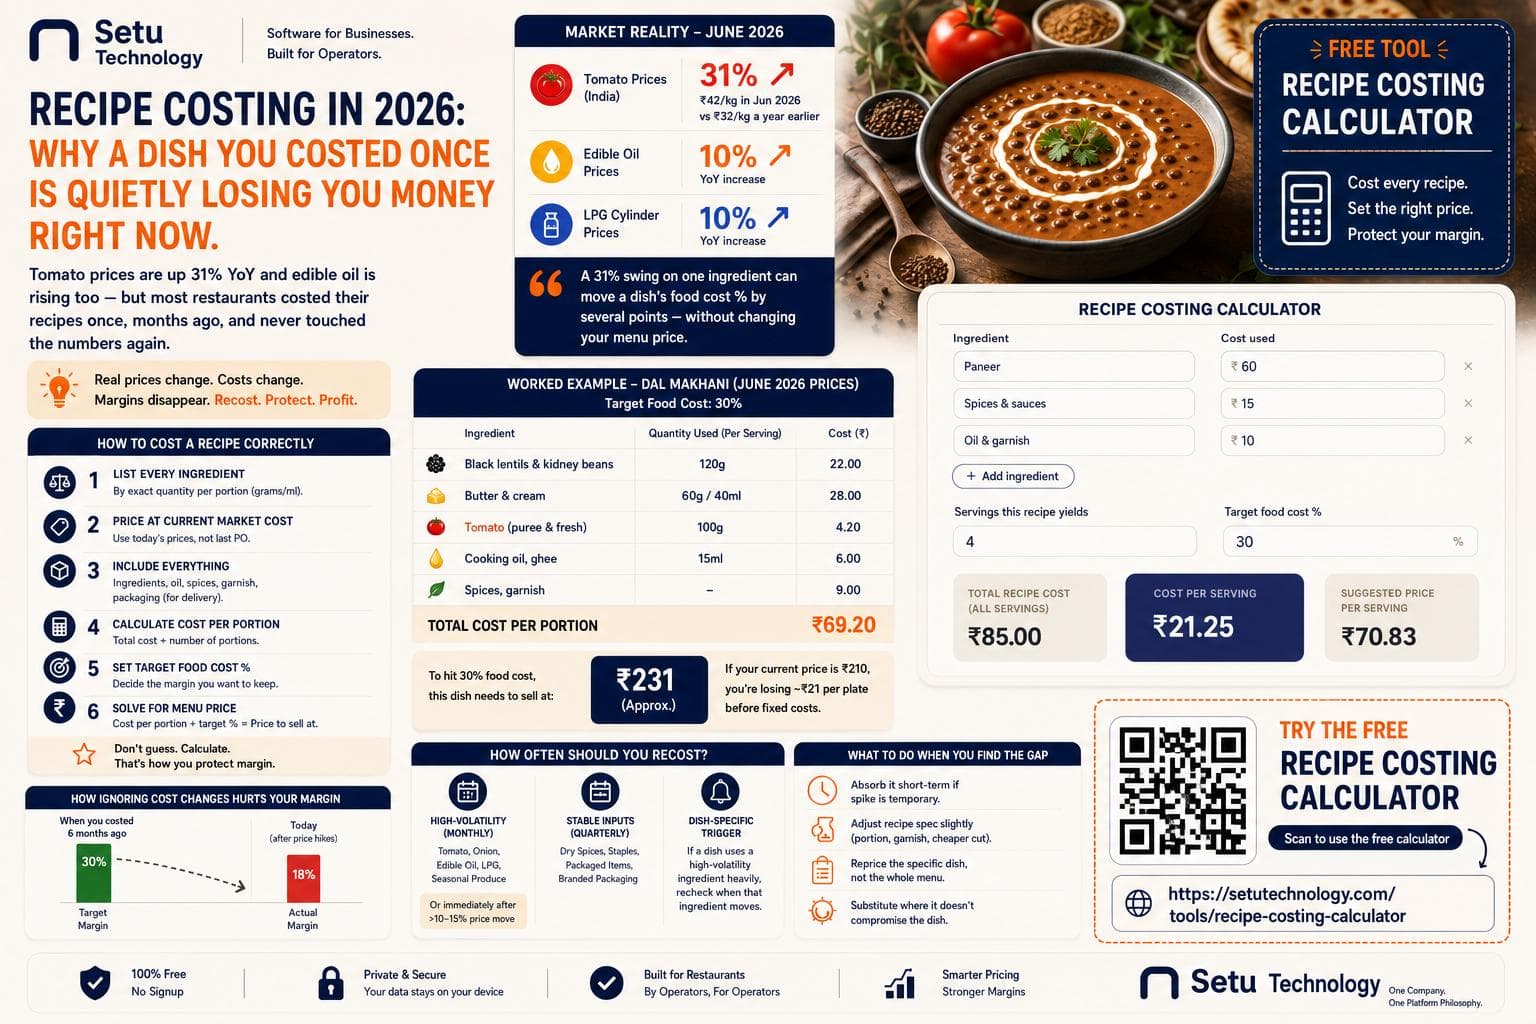
Recipe Costing in 2026: Why a Dish You Costed Once Is Quietly Losing You Money Right Now
Tomato prices are up 31% year-on-year and edible oil is climbing too - but most restaurants costed their recipes once, months ago, and never touched the numbers again. Here's how to fix that.
Read more →