Catching Supplier Price Creep: A Purchase Variance Walkthrough
Nobody sends you a letter announcing a price rise. What happens is that one line on one bill moves by a few rupees, you approve the bill because the total looks about right, and six months later your gross margin is two points thinner than last year with no single decision to point at. This is the quietest way a business loses money, and the only reliable way to catch it is to compare what you paid against what you expected to pay, line by line, on a schedule.
That comparison has a name — purchase price variance — and it takes about forty minutes a quarter once your purchase records are in one place. This is the full walkthrough, with a worked eight-line example you can copy, the three ways the method misleads you, and what to actually do with the answer.
Step one: set a baseline rate, not a budget
Pick one rate per item that represents what you believe you should be paying, and write it down with a date. The three defensible choices are the rate on your last negotiated agreement, the average rate you actually paid over a settled past quarter, or the rate you used when you last costed your menu or your selling prices. Any of the three works. What does not work is an aspiration, because then every variance you find is a comment on your optimism rather than on your supplier.
Keep the list short. Eight to fifteen items will cover the overwhelming majority of your purchase spend in most small businesses, and a baseline list of ninety items is a list nobody will maintain past the first quarter.
Step two: pull the actual rates
For each item you need the rate you actually paid most recently and the quantity you bought over the period. If your bills are entered as you receive them, this is a report rather than a project. The Purchase Register holds the bills with rates and quantities against each supplier, and the Supplier Book is where the history by supplier lives, so you can see whether a rate moved once or has been drifting for three months.
One discipline matters more than the tooling: compare like with like. Rate per kilogram against rate per kilogram, not rate per bag against rate per kilogram, and not a rate inclusive of freight against one that excludes it. Most of the alarming variances people find on their first pass are unit-of-measure errors, not price rises.
Step three: the arithmetic
The formula is deliberately plain. For each line, the variance is the difference between the two rates multiplied by the quantity you actually bought: (actual rate – baseline rate) × actual quantity. A positive answer means the line cost you more than you planned. A negative answer means it cost you less.
Here is a real-shaped example: a cafe-bakery's eight biggest recurring purchases over one quarter, with a baseline set in April 2026 and actual rates as at September. The figures are illustrative rather than any real business's, but the arithmetic is exact.
| Item | Baseline | Actual | Qty | Change | Variance |
|---|---|---|---|---|---|
| Refined flour, 50 kg bag | ₹1,420 | ₹1,486 | 180 | +4.6% | ₹11,880 |
| Milk, litre | ₹58 | ₹60 | 5,400 | +3.4% | ₹10,800 |
| Unsalted butter, kg | ₹462 | ₹498 | 240 | +7.8% | ₹8,640 |
| Cocoa powder, kg | ₹640 | ₹712 | 85 | +11.3% | ₹6,120 |
| Paper cups, box of 1,000 | ₹1,180 | ₹1,245 | 72 | +5.5% | ₹4,680 |
| Castor sugar, 25 kg bag | ₹1,075 | ₹1,090 | 96 | +1.4% | ₹1,440 |
| Takeaway boxes, box of 500 | ₹1,560 | ₹1,560 | 60 | 0.0% | ₹0 |
| Coffee beans, kg | ₹1,340 | ₹1,268 | 150 | –5.4% | –₹10,800 |
Baseline spend across the eight lines is ₹12,16,840. Actual spend is ₹12,49,600. The net variance is ₹32,760, or 2.69 per cent of baseline — call it ₹10,920 a month, and roughly ₹1,31,040 over a year if nothing changes. The Purchase Price Variance Calculator does each line and the total, which matters more than it sounds: variance arithmetic done by hand is where sign errors live.
Step four: read it properly
Three things in that table are worth more than the total, and all three are the kind of insight that only shows up when you lay the lines side by side.
The biggest percentage rise is not the biggest problem. Cocoa went up 11.3 per cent, the sharpest move on the list, and contributes ₹6,120. Flour went up 4.6 per cent and contributes ₹11,880 — nearly double, because you buy far more of it. If you negotiate in order of percentage you will spend your leverage on the wrong supplier. Rank by rupees.
Three lines carry almost all of it. Flour, milk and butter together account for ₹31,320 of the ₹32,760 net. That is your agenda for the next supplier conversation, and it is three conversations rather than eight.
Netting hides the damage. Add up only the adverse lines and the gross figure is ₹43,560. One favourable line — coffee down 5.4 per cent, worth ₹10,800 in your favour — masks a quarter of the problem. Always look at the adverse total alongside the net, or a lucky commodity swing will quietly fund a supplier who is drifting up on you.
What a falling rate does to your stock value
The coffee line has a second effect that people miss. If you held 40 kg at an average of ₹1,340 and received 60 kg at ₹1,268, your blended average is now ₹1,296.80 a kilogram, not ₹1,268. Every cup you cost at the new invoice rate is being costed about 2 per cent cheaper than the beans in your actual bin, and the gap persists until the old stock clears.
The same logic runs the other way and hurts more: when a rate rises, your recipe costs are stale in the direction that flatters your margin. This is the mechanism behind most quietly-wrong plate costs, and our piece on recipe costing through ingredient price swings covers how often it is worth recosting.
Three ways this method misleads you
- It cannot tell a price rise from a specification change. A cheaper rate on a thinner paper cup or a lower-fat butter is not a saving, it is a different product. Check the description, not only the number.
- It ignores what you bought too much of. Buying at the baseline rate but ordering 40 per cent more than you consumed shows up as zero variance and still ties up cash and creates waste. Variance is a rate story; quantity is a separate investigation, and the wastage side of it is usually the bigger number.
- It treats a one-off as a trend. A single emergency purchase from a neighbourhood shop at double the rate will dominate a line. Flag it and exclude it, or your baseline conversation starts with an excuse your supplier gets to use.
Turning the answer into money
A variance report nobody acts on is a hobby. Four moves, in order of how often they work.
- Take the top three lines to the supplier with the dates. Not "your prices went up" but "this rate moved from ₹462 to ₹498 between April and September on 240 kilograms". Specifics get a rate held or partially rolled back far more often than complaints do.
- Ask for a rate contract rather than a discount. A rate held in writing for a quarter on your three biggest lines is worth more than a one-time reduction, because it makes your costing true for three months instead of one bill.
- Quote the top lines out. Put the same specification to two or three suppliers and compare landed rates rather than list rates. The Vendor Comparison tool is built for that side-by-side, including the freight and payment terms that often decide it.
- Recost and reprice what moved. If flour and butter are permanently up, the selling price of anything built on them is now wrong. Fix it there rather than hoping volume absorbs it.
Then put a recurring forty minutes in the calendar at the end of every quarter and repeat it with the same eight lines. The value is in the series rather than any single run: by the third quarter you can see which suppliers hold a rate and which ones test you every cycle, and that is a far more useful thing to know than any one variance figure.
If the obstacle is not the method but the records — purchase bills entered weeks late, rates and quantities missing, no history to compare against — the variance report is not your problem yet. Our accounting and bookkeeping service exists to get purchase records entered and reconciled on a cycle, which is what makes this kind of analysis possible in the first place.
Frequently asked questions
Quarterly suits most small businesses, with a monthly pass on the three or four lines that dominate your spend. Running it more often than your purchase records are updated produces noise rather than insight.
More from Inventory Ops
Setu Stock Register vs Zoho Inventory: Which Fits a Small Shop in 2026?
Zoho Inventory is a proper order-and-inventory platform that starts free and then prices by how many orders you push through it. Setu's Stock Register is a free browser tool with no order cap. Here's which trade makes sense for your shop in 2026.
Read more →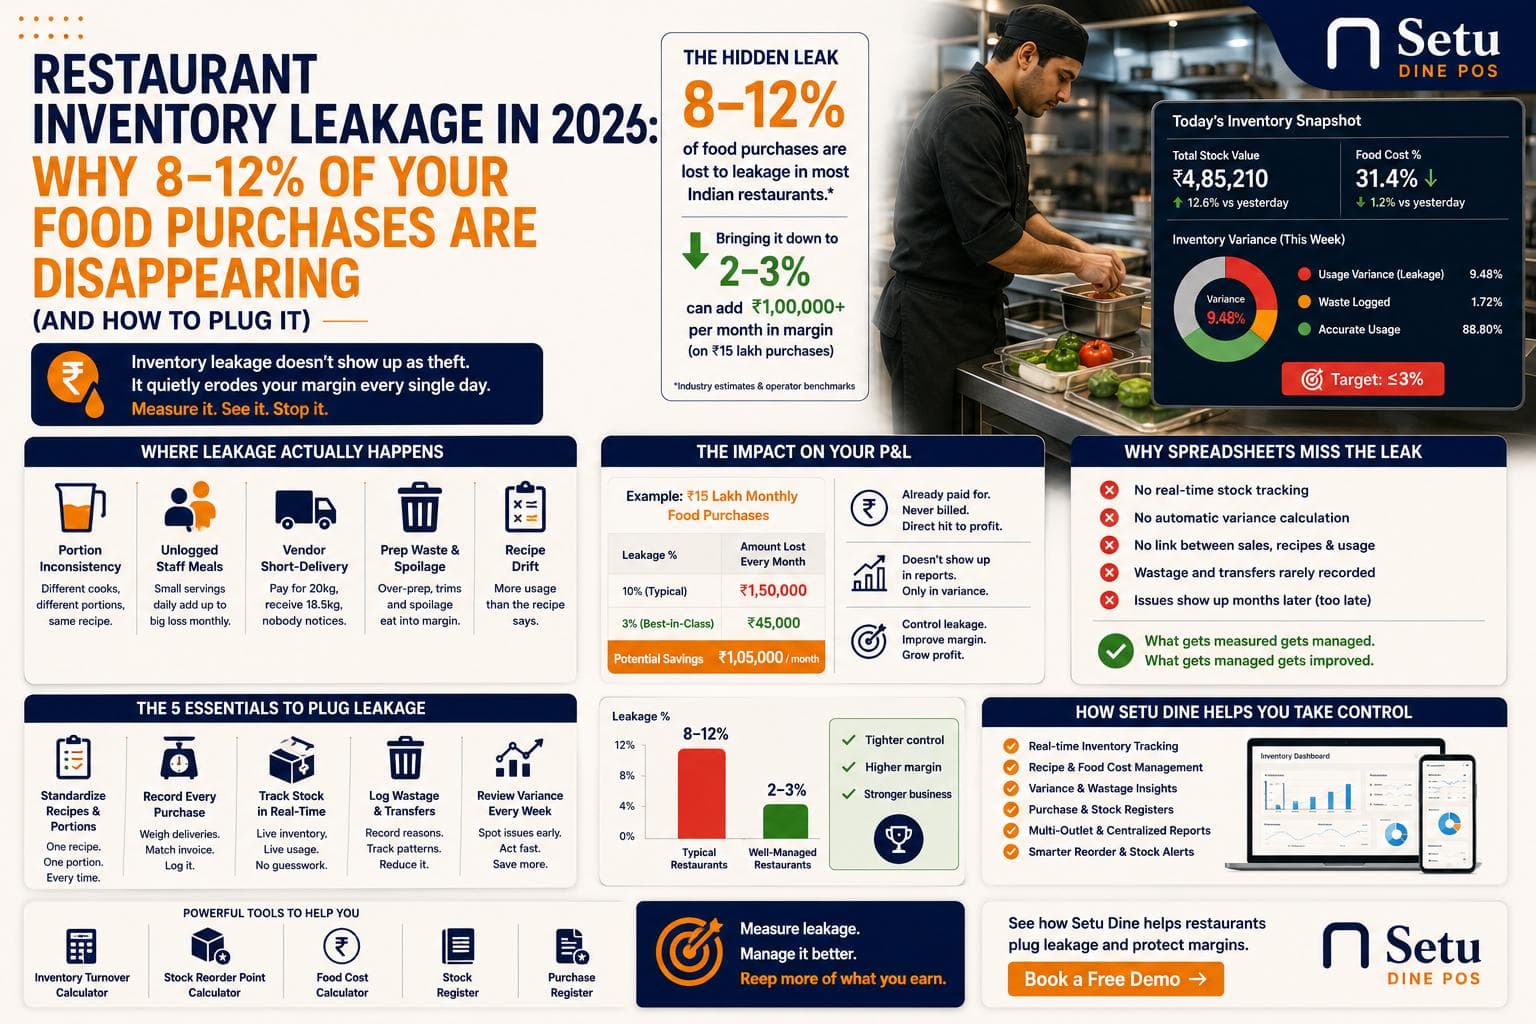
Restaurant Inventory Leakage in 2026: Why 8–12% of Your Food Purchases Are Disappearing (And How to Plug It)
Most restaurant owners can quote their food cost percentage from memory. Almost none can tell you how much of it disappears before it ever reaches a bill. Here's where that gap hides, and how to close it.
Read more →